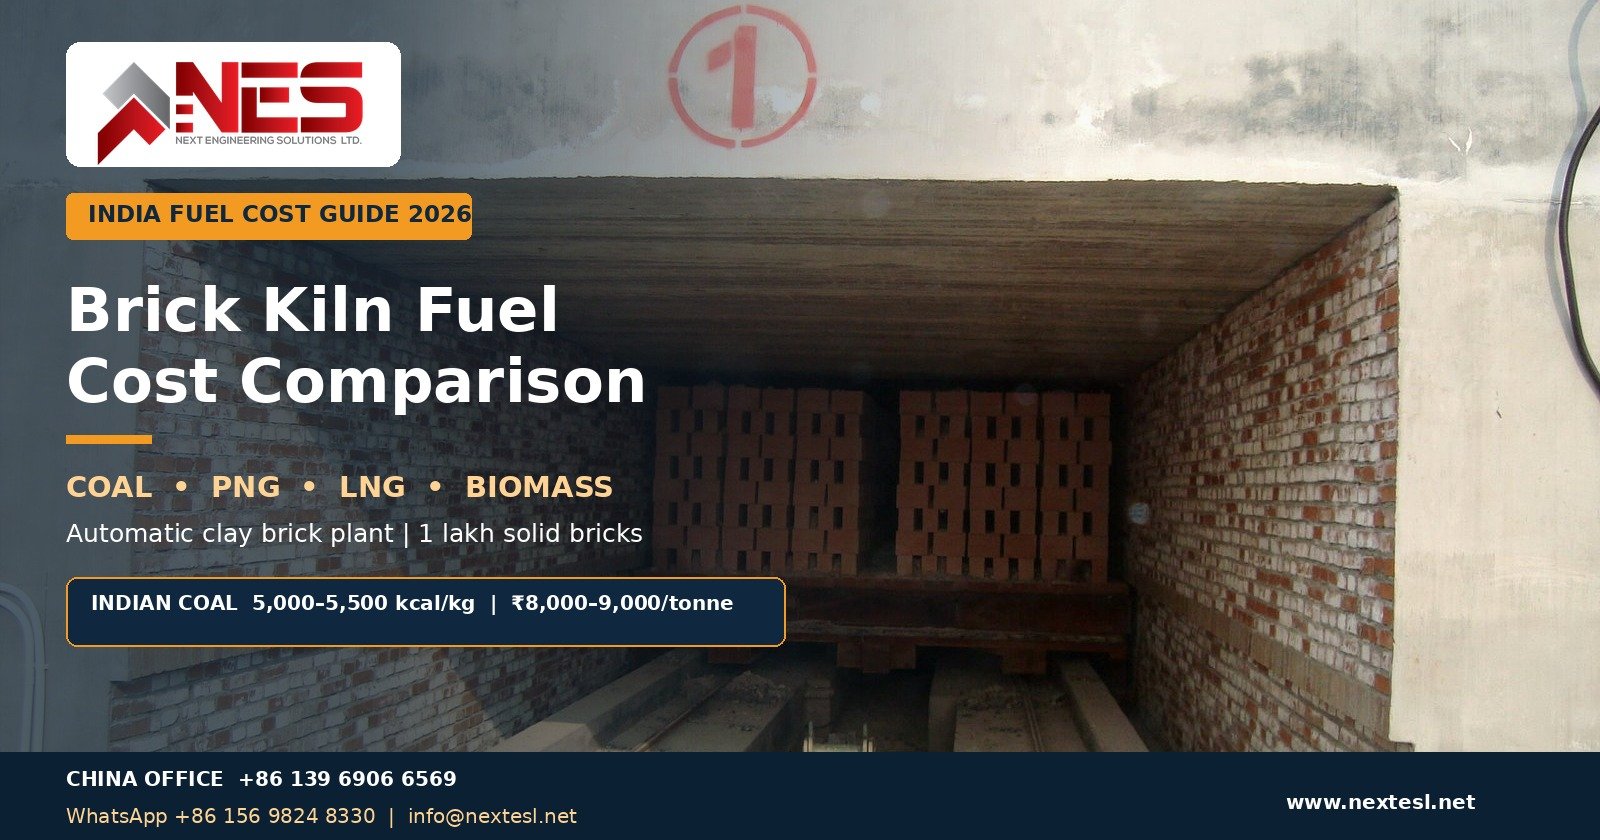
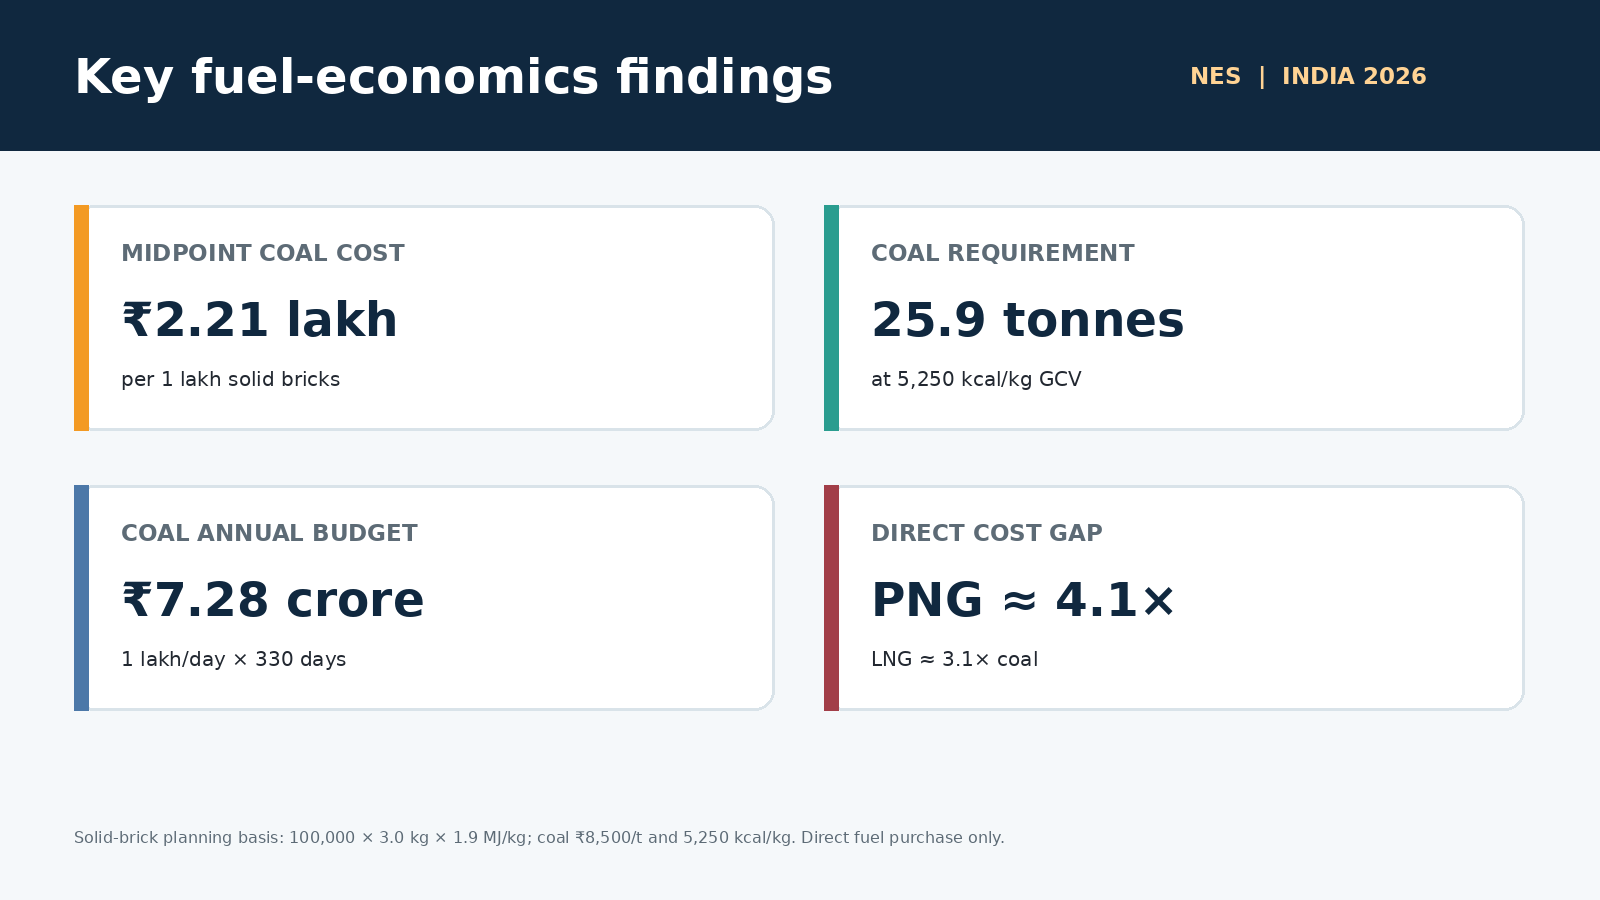
For the Indian solid-brick planning case used in this article, coal is the clear direct-cost winner. With coal at ₹8,000–₹9,000 per tonne and 5,000–5,500 kcal/kg GCV, the fixed 1.9 MJ/kg tunnel-kiln basis gives about ₹1.98–₹2.45 lakh to fire 1 lakh solid bricks. The midpoint is approximately 25.9 tonnes of coal and ₹2.21 lakh, or ₹2.21 per fired brick, before coal handling, emission control, finance and reject losses.
Lowest direct fuel cost: coal. Second-lowest in the worked example: biomass pellets. Best firing control and cleanest onsite handling: PNG or LNG. For ordinary red-clay bricks, however, the gas fuels in this sample cost roughly three to four times as much as coal before their operational benefits are valued.
For most new Indian automatic common-brick plants where coal is legally permitted and reliably available, NES would normally begin feasibility work with a controlled coal-fired tunnel kiln, heat recovery to the dryer, robust dust and emission controls, and a fuel-flexible design for future conversion or co-firing.
1. Engineering Basis: Compare Heat, Not Only Fuel Weight
A client cannot compare coal, gas and biomass only by asking, “What is the price per kilogram?” One kilogram of each fuel contains a different amount of heat. PNG is sold by standard cubic metre, LNG is commonly priced by mass or energy, and coal quality changes with GCV, moisture, ash and volatile matter.
This article therefore converts every fuel into the same required thermal-energy basis.
| Calculation item | Base value | Why it matters |
|---|---|---|
| Bricks fired | 100,000 pieces | The comparison unit requested by most plant investors in India. |
| Average finished brick weight | 3.0 kg/brick | Fuel demand follows product mass, not piece count alone. |
| Total fired product mass | 300,000 kg (300 t) | 100,000 × 3.0 kg. |
| Specific thermal energy | 1.9 MJ/kg fired brick | Conservative solid-brick firing basis including recovered heat used for drying; not a performance guarantee. |
| Total purchased fuel energy | 570,000 MJ (570 GJ) | 300,000 kg × 1.9 MJ/kg. |
| Energy in kcal | About 136.23 million kcal | Used with the quoted GCV of each fuel. |
Total fuel energy = brick quantity × fired weight × specific thermal energyFuel quantity = total energy in kcal ÷ fuel GCVWhy the main model uses 1.9 MJ/kg
The published tunnel-kiln project guideline used in this article reports different benchmarks for different products. It shows approximately 1.3 MJ/kg total energy for hollow blocks and about 2.0 MJ/kg total energy for solid bricks; its example for solid-brick or paver firing, including heat supplied to drying, is approximately 1.9 MJ/kg. Because Indian investors commonly ask about solid red bricks, 1.9 MJ/kg is the safer main budget basis. An efficient perforated or hollow product can be materially lower.
| Planning case | Energy input | How to use it |
|---|---|---|
| Hollow-block benchmark | About 1.3 MJ/kg | Reference only; actual value depends on void percentage, clay, dryer and firing curve. |
| Efficient sensitivity case | 1.4 MJ/kg | Shows what a high-performing lower-energy product/system could approach. |
| Solid-brick firing base case | 1.9 MJ/kg | Main financial model in this article. |
| Solid-brick total-energy benchmark | About 2.0 MJ/kg | Useful conservative cross-check for full brick-making energy. |
Why actual brick weight can change the answer
At the same kiln efficiency, a 3.5 kg solid brick requires about 40% more firing energy per piece than a 2.5 kg brick. Hollow or perforated products can therefore show a lower cost per piece even when the cost per tonne of fired product is similar. For feasibility, weigh representative dried and fired bricks—do not depend only on nominal dimensions.
| Fired weight | Coal for 1 lakh bricks | Coal bill | Direct coal cost/brick |
|---|---|---|---|
| 2.5 kg/brick | 21.62 t | ₹1.84 lakh | ₹1.84 |
| 3.0 kg/brick (base) | 25.95 t | ₹2.21 lakh | ₹2.21 |
| 3.5 kg/brick | 30.27 t | ₹2.57 lakh | ₹2.57 |
Fixed assumptions: 1.9 MJ/kg SEC, coal GCV 5,250 kcal/kg and delivered coal price ₹8,500/tonne.
2. Coal vs PNG vs LNG vs Biomass: Cost for 1 Lakh Bricks
The following is an equal-energy comparison. It uses the same 570 GJ fuel input for every option so that the price and calorific-value effect is visible. A final kiln design may use different energy with different products, burners, fuels, moisture conditions and operating control.
| Fuel | GCV used | Planning price | Required quantity | Fuel bill/1 lakh | ₹/brick | Vs coal |
|---|---|---|---|---|---|---|
| Coal | 5,250 kcal/kg | ₹8.50/kg | 25.95 t | ₹2.21 lakh | ₹2.21 | 1.00× |
| Biomass pellets | 4,000 kcal/kg | ₹10/kg | 34.06 t | ₹3.41 lakh | ₹3.41 | 1.54× |
| LNG | 12,000 kcal/kg | ₹60/kg | 11.35 t | ₹6.81 lakh | ₹6.81 | 3.09× |
| PNG | 9,000 kcal/SCM | ₹60/SCM | 15,137 SCM | ₹9.08 lakh | ₹9.08 | 4.12× |
Excluded: electricity, milling, conveying, storage loss, labour, ash disposal, emission-control OPEX, gas demand charges, minimum offtake, LNG storage/vaporization, maintenance, finance, startup/shutdown fuel and rejects.
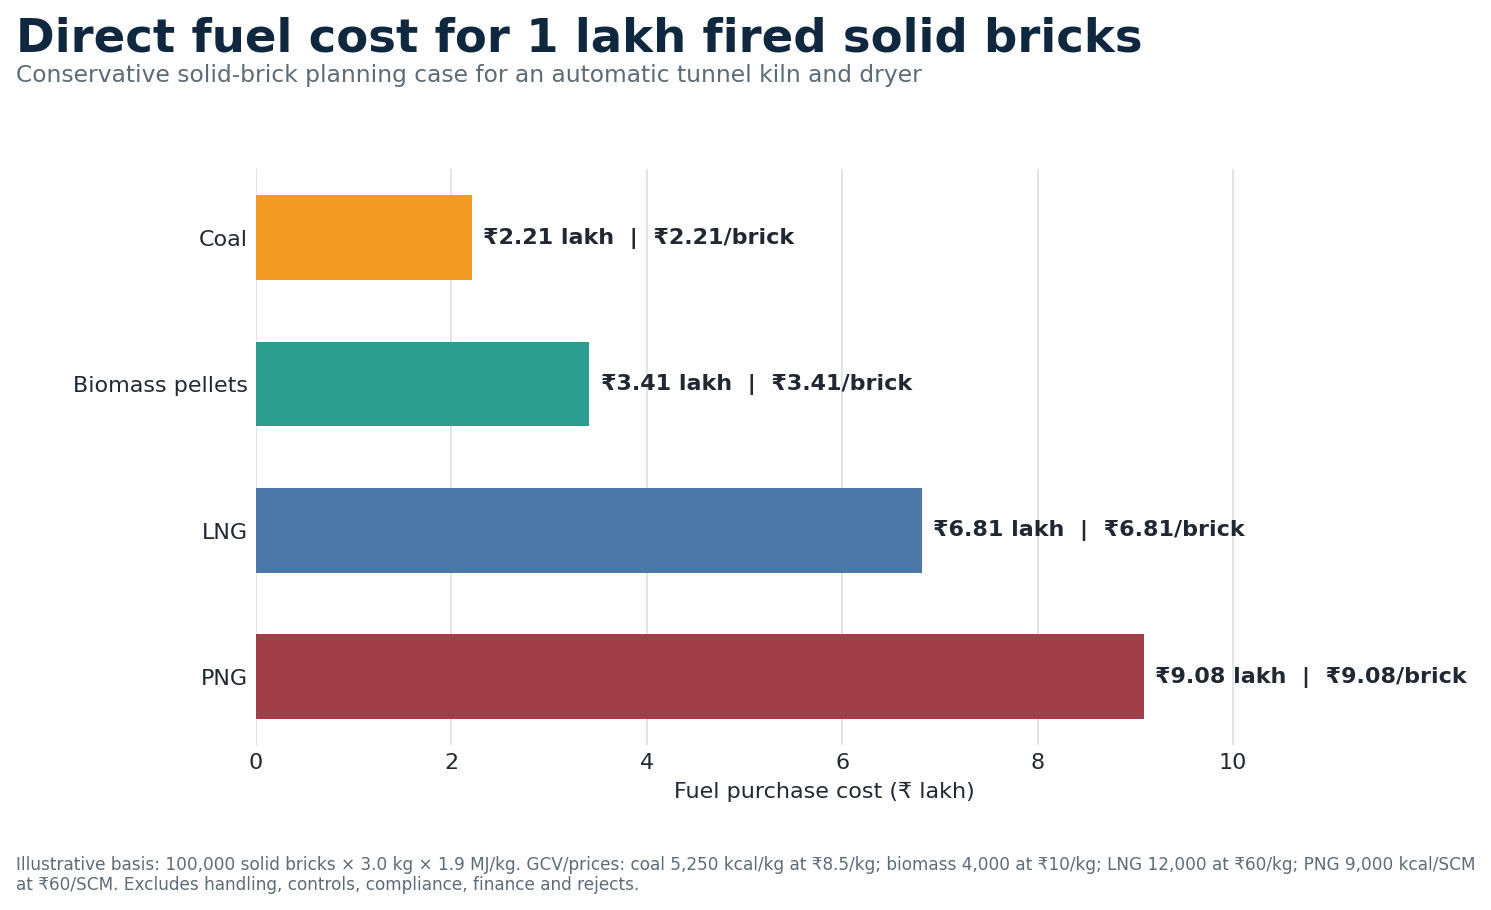
- Coal — ₹2.21/brick
- Biomass pellets — ₹3.41/brick
- LNG — ₹6.81/brick
- PNG — ₹9.08/brick
3. Indian Coal: Realistic Cost Range at ₹8,000–₹9,000/Tonne
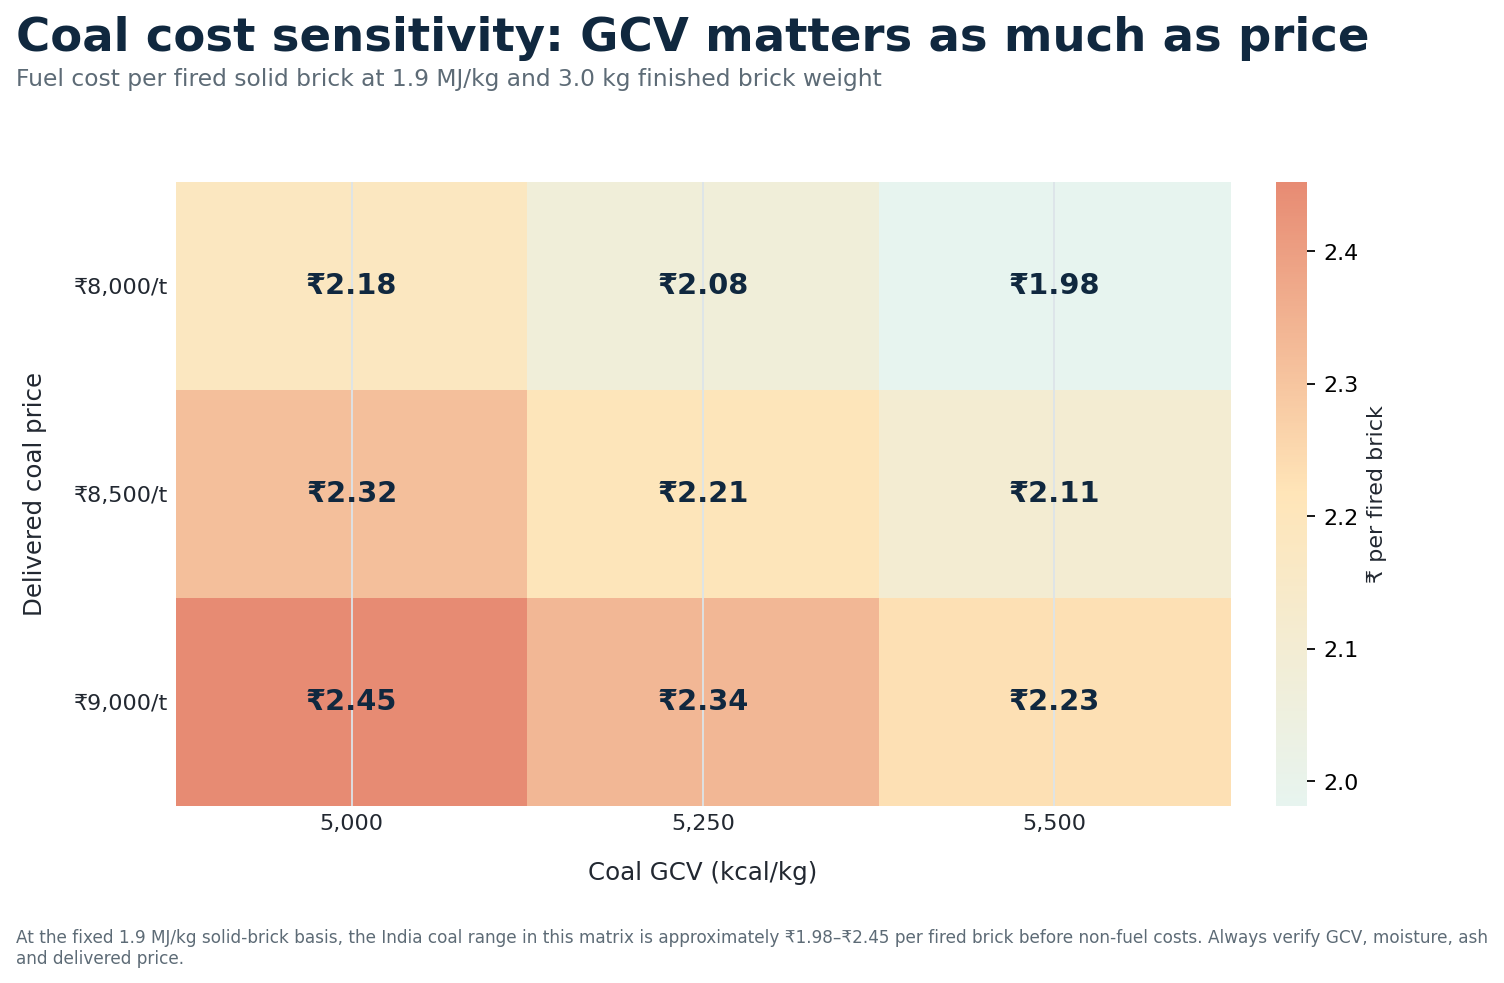
The midpoint alone is not enough for project finance. The first sensitivity below holds solid-brick SEC at 1.9 MJ/kg and changes the two coal variables supplied for this analysis: delivered price and GCV. A low-quality or wet coal shipment can erase the apparent saving from a lower invoice price.
| Coal case | Kiln SEC | Coal GCV | Price | Coal quantity | Fuel bill | ₹/brick |
|---|---|---|---|---|---|---|
| Favourable coal purchase | 1.90 MJ/kg | 5,500 kcal/kg | ₹8,000/t | 24.77 t | ₹1.98 lakh | ₹1.98 |
| Midpoint planning | 1.90 MJ/kg | 5,250 kcal/kg | ₹8,500/t | 25.95 t | ₹2.21 lakh | ₹2.21 |
| Adverse coal purchase | 1.90 MJ/kg | 5,000 kcal/kg | ₹9,000/t | 27.25 t | ₹2.45 lakh | ₹2.45 |
This is why a purchase contract should not specify only “coal at ₹X per tonne.” It should define the agreed GCV basis, moisture, ash, sulphur, volatile matter, particle-size distribution, sampling method, laboratory method, rejection limits and price adjustment for off-spec material.
Coal quality checks before final machinery selection
- GCV/NCV: determines fuel quantity and true energy price.
- Total moisture: water must be heated and evaporated before the fuel can heat the bricks.
- Ash percentage and chemistry: affects handling, deposits, product contamination and flue-gas equipment.
- Volatile matter: influences ignition and the combustion zone.
- Sulphur: affects emissions, corrosion risk and environmental-control design.
- Particle size and grindability: must match the crusher, mill, screen, feeder and firing method.
4. The Most Useful Comparison: Rupees per Gigajoule
Delivered energy cost separates the fuel-price issue from the kiln issue. Under the midpoint assumptions, coal costs about ₹387/GJ. Biomass is about ₹598/GJ, LNG about ₹1,195/GJ, and PNG about ₹1,593/GJ.
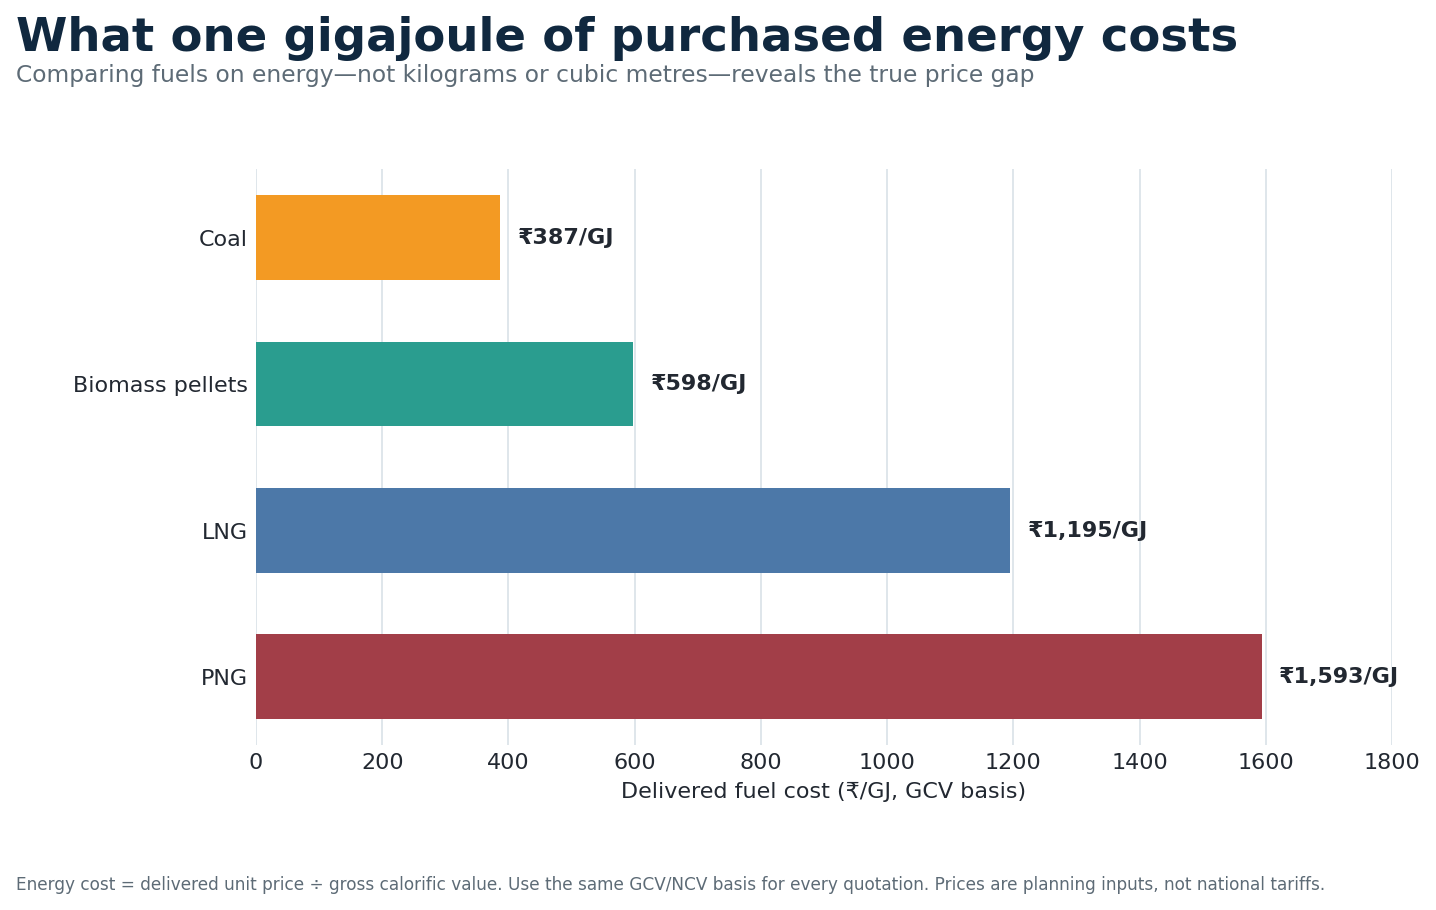
Gas can offer better modulation, faster response and cleaner onsite handling, but “more controllable” does not automatically mean “lower cost.” At the sample prices, PNG purchased energy is more than four times the coal energy price. A reasonable improvement in gas firing control cannot, by itself, close such a large gap for ordinary common bricks.
5. Technical and Commercial Assessment of Each Fuel
Coal: lowest direct OPEX
Best fit: high-volume common-brick production where coal is permitted, consistent and competitively delivered.
- Lowest purchased-energy cost in this study
- Established supply and firing practices in many regions
- Can use external feeding, internal fuel or a controlled combination after clay testing
- Needs preparation, storage, dust control, skilled feeding and ash management
- Quality variation can cause black core, colour variation and unstable zones
- Air-pollution controls and consent conditions can materially change total cost
Biomass pellets: possible second option
Best fit: locations with dependable, specification-controlled local supply or a regulatory/co-firing requirement.
- Closer to coal cost than gas in the sample case
- Can diversify fuel supply and use agricultural residue
- May suit staged co-firing after trial production
- Lower GCV means more tonnes, larger storage and higher conveying duty
- Moisture, fines, ash, chlorine, alkali and ash-fusion behaviour vary by feedstock
- Seasonal supply and pellet durability must be tested
LNG: controllable gas without a pipeline
Best fit: premium products or restricted sites where gas firing is required but PNG is unavailable.
- Clean burner-side operation and responsive temperature control
- Lower physical fuel quantity because of high GCV
- Can support automated fuel-to-air control
- Sample direct cost is about 3.1× coal
- Requires tanker logistics, storage, vaporization, gas train, detection and safety engineering
- Contract price and supply can follow volatile LNG markets
PNG: simplest clean onsite handling
Best fit: pipeline-connected sites with a competitive industrial tariff, strong supply pressure and high value for clean, precise control.
- No coal yard, milling or kiln-side ash handling
- Excellent burner modulation, flame supervision and automation potential
- Lower onsite particulate burden from fuel ash
- Highest direct cost in this sample—about 4.1× coal
- Connection, meter, pressure, demand/minimum-take and interruption terms matter
- Final price is location- and contract-specific
Capital equipment that must be included
| Fuel | Typical project equipment | Often-forgotten costs |
|---|---|---|
| Coal | Covered yard/silo, crusher or mill, screens, conveyors, weigh feeders, distribution pipes/ports, combustion-air control, dust collection and suitable flue-gas treatment | Moisture loss, dust loss, grinding power, wear parts, cleaning labour, ash disposal and environmental monitoring |
| Biomass | Dry covered storage, receiving and screening, metering feeders, fire protection, modified injection/combustion system and ash control | Bulk-volume requirement, broken-pellet fines, seasonal inventory, bridging, self-heating/fire risk and feedstock-specific deposits |
| LNG | Unloading station, cryogenic storage, vaporizers, pressure-reduction and metering, burner trains, gas detection, ESD and approved safety layout | Tanker scheduling, storage rental/finance, boil-off management, hazardous-area electrical scope and statutory inspections |
| PNG | Pipeline connection, regulating and metering station, burner trains, double shutoff/bleed where required, flame safeguards, gas detection and ESD | Security deposit, fixed/demand charge, minimum guaranteed offtake, pressure upgrade and interruption backup |
6. What Price Would PNG, LNG or Biomass Need to Match Coal?
Break-even pricing gives investors a fast screening rule. At coal ₹8.50/kg and 5,250 kcal/kg GCV, the competing fuel must deliver one unit of heat at approximately the same cost as coal.
| Fuel | Sample price | Equal-energy price matching coal | If gas uses 10% less energy | Commercial reading |
|---|---|---|---|---|
| Biomass pellets | ₹10/kg | About ₹6.48/kg | Not assumed | Needs a much lower delivered price, a coal-cost penalty, or other commercial benefit to match. |
| LNG | ₹60/kg | About ₹19.43/kg | About ₹21.59/kg | Still far below the sample ₹60/kg price. |
| PNG | ₹60/SCM | About ₹14.57/SCM | About ₹16.19/SCM | Even a 10% energy advantage does not close the sample price gap. |
These thresholds compare direct fuel energy only. If coal adds substantial handling, compliance, quality-loss or downtime cost, that verified difference may be added to the allowable competing-fuel price.
7. Calculate Cost per Saleable A-Grade Brick
A low fuel bill can hide poor production. The correct commercial denominator is the number of saleable bricks, not only the pieces loaded into the kiln. Overfiring, underfiring, black core, cracks, warping and colour variation all raise the effective fuel cost of good output.
Fuel cost per saleable brick = total fuel bill ÷ saleable A-grade bricksThe table below deliberately gives cleaner fuels a higher illustrative A-grade yield. It demonstrates whether the quality benefit alone is large enough to reverse the cost ranking.
| Fuel | Fuel bill for 100,000 fired | Illustrative A-grade yield | A-grade bricks | Fuel cost/A-grade brick |
|---|---|---|---|---|
| Coal | ₹2.21 lakh | 92% | 92,000 | ₹2.40 |
| Biomass pellets | ₹3.41 lakh | 94% | 94,000 | ₹3.62 |
| LNG | ₹6.81 lakh | 97% | 97,000 | ₹7.02 |
| PNG | ₹9.08 lakh | 97% | 97,000 | ₹9.36 |
The yields are a sensitivity example—not expected plant guarantees. Even with the favourable gas-yield assumption, gas does not become the lowest fuel cost at the sample prices.
8. Annual Fuel Budget for 50K, 100K and 200K Bricks per Day
Small per-brick differences become major annual cash-flow differences. The following table uses 330 operating days and the same midpoint assumptions.
| Daily fired output | Coal | Biomass pellets | LNG | PNG |
|---|---|---|---|---|
| 50,000/day | ₹3.64 cr/year | ₹5.62 cr/year | ₹11.24 cr/year | ₹14.99 cr/year |
| 100,000/day | ₹7.28 cr/year | ₹11.24 cr/year | ₹22.48 cr/year | ₹29.97 cr/year |
| 200,000/day | ₹14.56 cr/year | ₹22.48 cr/year | ₹44.96 cr/year | ₹59.94 cr/year |
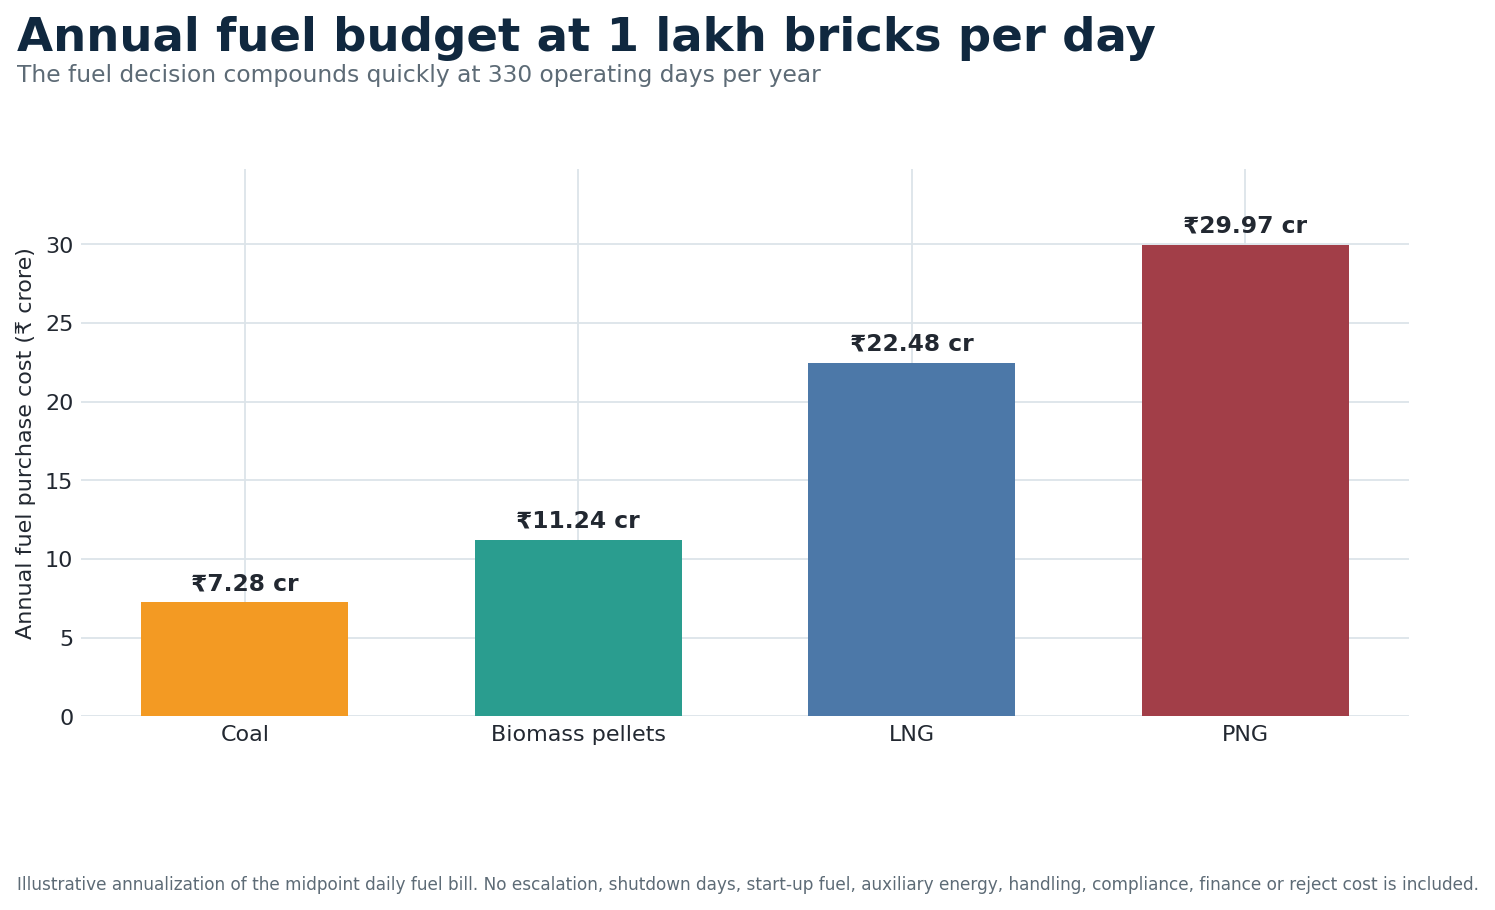
These are not total manufacturing costs. They exclude clay, electricity, diesel, labour, maintenance, packing, administration, tax, finance and sales expenses. They are designed to isolate the fuel decision.
9. The Cheapest Fuel Is Only Half the Strategy
An inefficient coal kiln can waste more money than a well-operated coal kiln saves. The project should therefore optimize both fuel price and specific thermal energy consumption.
What a 10% SEC reduction is worth
At 1 lakh bricks/day and 330 days/year, a 10% reduction in purchased thermal energy saves approximately:
| Fuel | Daily saving | Annual saving |
|---|---|---|
| Coal | About ₹22,060/day | About ₹72.8 lakh/year |
| Biomass pellets | About ₹34,060/day | About ₹1.12 crore/year |
| LNG | About ₹68,120/day | About ₹2.25 crore/year |
| PNG | About ₹90,820/day | About ₹3.00 crore/year |
High-return kiln and dryer measures
- Dry bricks correctly before firing: uncontrolled residual moisture wastes firing-zone heat and increases cracking risk.
- Recover cooling-zone heat: transfer useful hot air to the tunnel dryer instead of exhausting it.
- Seal kiln cars and pressure zones: false-air leakage disturbs temperature, oxygen and draft.
- Balance airflow: fan selection, dampers and VFD control must match the actual pressure network.
- Control the firing curve: use sufficient temperature measurement, pressure indication and disciplined car movement.
- Stabilize coal preparation and dosing: consistent particle size and metered distribution prevent local over- and underfiring.
- Optimize setting pattern: bricks must expose enough area for uniform gas flow without sacrificing loading density.
- Track SEC every shift: record fuel energy divided by tonnes of good fired product, not only tonnes of fuel per day.
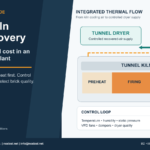
NES designs the tunnel kiln and tunnel dryer as one connected thermal system. Fuel selection should be completed together with clay testing, dryer design, fan calculations, heat recovery, kiln-car setting, firing curve and emission-control scope.
10. Which Fuel Is Most Cost-Effective for Your New Plant?
| Project condition | Most practical starting option | Reason |
|---|---|---|
| Common red bricks; high volume; coal permitted; reliable 5,000–5,500 GCV supply | Controlled coal firing | Lowest direct and annual fuel cost in this analysis. |
| Competitive local pellets; proven specification; co-firing requirement or supply-diversification goal | Coal + biomass trial, then scale | Can reduce coal dependency, but price, volume and ash behaviour must be proven. |
| Premium facing bricks; strict onsite cleanliness; low industrial gas tariff; stable pipeline pressure | PNG | Strong control and low handling burden may justify the premium. |
| No pipeline; gas is required; dependable tanker route; high-value product | LNG | Provides gas firing, but storage, safety and high fuel cost must be accepted. |
| Uncertain future regulation or fuel availability | Fuel-flexible kiln concept | Preserves options for staged conversion, subject to proper engineering. |
At the coal parameters supplied—₹8,000–₹9,000/tonne and 5,000–5,500 kcal/kg GCV—coal is the most cost-efficient and cost-effective base fuel for a high-volume automatic common clay brick plant in India. The preferred solution is not uncontrolled coal firing; it is a properly engineered coal system with consistent fuel specification, metered feeding, balanced combustion air, waste-heat recovery, kiln instrumentation, dust management, suitable emission controls and a verified production guarantee.
PNG or LNG becomes commercially preferable only when the project can prove enough value from lower handling, lower compliance burden, higher A-grade yield, premium product pricing, reduced downtime or a compulsory clean-fuel condition to cover the very large fuel-price gap.
Data required before NES can confirm your fuel budget
- Project location, state and fuel permissions
- Target daily capacity and annual operating days
- Brick dimensions, final fired weight and product mix
- Clay test report, internal fuel content and firing-temperature range
- Green-brick and dryer-outlet moisture
- Representative coal, gas, LNG or biomass laboratory certificate
- Delivered quotations including tax, freight, unloading, minimum offtake and validity
- Proposed kiln and dryer dimensions, setting pattern and car cycle
- Local emission limits, required control equipment and consent conditions
Need a Fuel and Kiln Feasibility Study?
Next Engineering Solutions Ltd can prepare a project-specific heat balance, fuel-consumption estimate, machinery scope, kiln and dryer concept, CAPEX/OPEX comparison and implementation plan for a new or upgraded automatic clay brick plant.
Request a Project Quotation WhatsApp China OfficeChina phone: +86 139 6906 6569 | WhatsApp: +86 156 9824 8330
Email: info@nextesl.net
Frequently Asked Questions
How much coal is required to fire 1 lakh bricks?
For 100,000 solid bricks weighing 3.0 kg each and a tunnel-kiln SEC of 1.9 MJ/kg, coal at 5,250 kcal/kg GCV requires about 25.9 tonnes. Across the stated 5,000–5,500 kcal/kg coal range, the energy-equivalent requirement is approximately 24.8–27.2 tonnes. An efficient hollow or perforated product can use materially less. Actual consumption must be confirmed from brick weight, clay, moisture, kiln, dryer and operating data.
What is the coal firing cost for 1 lakh bricks in India?
At ₹8,000–₹9,000/tonne, 5,000–5,500 kcal/kg GCV and the fixed 1.9 MJ/kg solid-brick basis, this model gives about ₹1.98–₹2.45 lakh, or ₹1.98–₹2.45 per fired brick. The midpoint is approximately ₹2.21 lakh. This is direct coal purchase cost, not total manufacturing cost.
Why is this coal estimate lower than a calculation using ₹16/kg?
Because the delivered coal price has been revised from ₹16,000/tonne to ₹8,000–₹9,000/tonne. At the same GCV and kiln energy use, halving the coal price nearly halves the direct fuel bill.
Is PNG more energy-efficient than coal in a tunnel kiln?
PNG normally offers faster burner response, easier fuel-to-air control and no fuel ash. These advantages can improve operating consistency. However, energy efficiency and cost efficiency are different: at the sample ₹60/SCM price, even a 10% reduction in gas energy use would not make PNG cheaper than the midpoint coal case.
Can biomass pellets replace coal completely?
Technically it may be possible in a suitably designed system, but it should not be assumed from price alone. Pellet GCV, moisture, durability, fines, ash chemistry, chlorine, alkali, storage volume and supply reliability must be tested. For an existing coal system, begin with laboratory review and a controlled co-firing trial.
Which coal value should be used: GCV or NCV?
Either can be used if every fuel and quotation is converted to the same basis. Because this article starts with coal GCV, all fuels are compared on a GCV basis. Do not mix a coal GCV value with a gas NCV value.
Does the cheapest fuel always create the cheapest brick?
No. Total cost per saleable brick also includes handling, electricity, emission controls, maintenance, finance, labour, downtime and reject loss. Coal remains the clear winner in this sample, but a project-specific total-cost model is still required.
Which fuel should a new automatic clay brick plant choose?
For common bricks under the stated Indian coal conditions, controlled coal firing is the strongest cost starting point. Choose PNG or LNG only when the site, regulation, product quality and verified commercial benefits justify the premium. Consider biomass where a reliable low-cost specification and suitable combustion design are available.
Technical References and Calculation Notes
- Climate & Clean Air Coalition, Tunnel Kiln Technology Overview and Project Assessment Guideline, 2019. The report covers tunnel-kiln design, fuel consumption, energy efficiency, operating cost and project assessment.
- World Bank, Dirty Stacks, High Stakes: An Overview of Brick Sector in South Asia, 2020.
- Government of India, Ministry of Power SAMARTH Mission, biomass co-firing resources and model procurement documents. Biomass specifications and policy requirements should be checked against the latest applicable document.
- Next Engineering Solutions Ltd, Tunnel Kiln & Tunnel Dryer Clay Brick Plant—capacity, process, machinery and project data requirements.
Method note: 1 MJ = approximately 239.006 kcal. All calculations are rounded for client readability. The main 1.9 MJ/kg solid-brick case, the lower product benchmarks and the sample GCV values are feasibility inputs—not an equipment guarantee. Final performance must be tied to an agreed product, raw material, moisture, loading pattern, fuel specification, firing curve and acceptance test.